Mastering Email Marketing Metrics: 2026 Guide
Email marketing metrics show whether your list trusts you, your message matches intent, and your campaigns create revenue. This 2026 guide explains the core engagement, deliverability, outcome, dashboard, and troubleshooting metrics SMBs should track.
 Sohail Hussain19 min read
Most SMBs still treat email like a publishing tool. Send campaign, check opens, move on. That misses the true purpose of email marketing metrics. They're not vanity numbers. They're operating signals that tell you whether your list trusts you, whether your message matches intent, and whether your email program is producing revenue instead of just activity.
A useful starting point is simple: the average email marketing open rate across all industries is 21.33% according to Charle Agency's email marketing statistics roundup. That means roughly one in five delivered emails gets opened. For a business owner, that should immediately reframe the conversation. If only a slice of your audience even sees the message, every decision before the open matters, and every decision after the open has to carry commercial weight.
If you're serious about improving email marketing ROI, the fix usually isn't “send more emails.” It's tracking the right numbers in sequence, then acting on them. And if you want a broader baseline for how teams think about channel performance, Mailneo's own email marketing statistics overview is a useful companion read.
Why Email Marketing Metrics Are Your Growth Compass
Email is one of the few marketing channels where you can watch the whole customer journey in a relatively clean line. Message sent. Email opened. Link clicked. Form completed. Purchase made. Renewal influenced. Few channels give you that much visibility without relying entirely on rented attention from an ad platform.
That's why I treat metrics like a cockpit, not a report card. A pilot doesn't stare at one gauge and assume the plane is fine. A business owner shouldn't stare at open rate alone and assume the email program is healthy. One metric can flatter you. A set of related metrics tells the truth.
Metrics only matter when they change a decision
A good email dashboard should answer practical questions:
- Should you keep this segment active: If engagement is fading and complaints rise, your list hygiene needs work.
- Is your offer clear enough: If people open but don't click, the body copy or CTA is doing a poor job.
- Did the campaign create business value: If clicks happen but conversions stall, the landing page or offer is breaking trust.
- Should you change cadence: If unsubscribes jump after a frequency change, the audience is telling you the pace is off.
Practical rule: Never review a metric without asking what action it should trigger.
I've seen e-commerce teams celebrate high opens on a discount email that barely sold. I've seen SaaS teams dismiss a modest open rate on a product education series that drove strong demos and activations. The first team optimized for curiosity. The second optimized for outcomes. That distinction matters.
Good metrics create focus, not noise
Most underperforming email programs don't suffer from lack of data. They suffer from too much data and too little interpretation. ESP dashboards can flood you with numbers, but the useful question is always the same: what does this metric say about audience fit, message quality, and business impact?
Think of email marketing metrics like a set of road signs. Open rate tells you whether the road is visible. Click rate tells you whether drivers took the exit. Conversion tells you whether they reached the destination you wanted.
When those signals are wired together, email stops being “the newsletter.” It becomes a measurable growth channel.
The Foundation Core Engagement Metrics
Core engagement metrics answer a simple operational question: where did attention turn into intent, and where did it stall? They sit between delivery and revenue. That makes them useful for diagnosis, not final judgment.
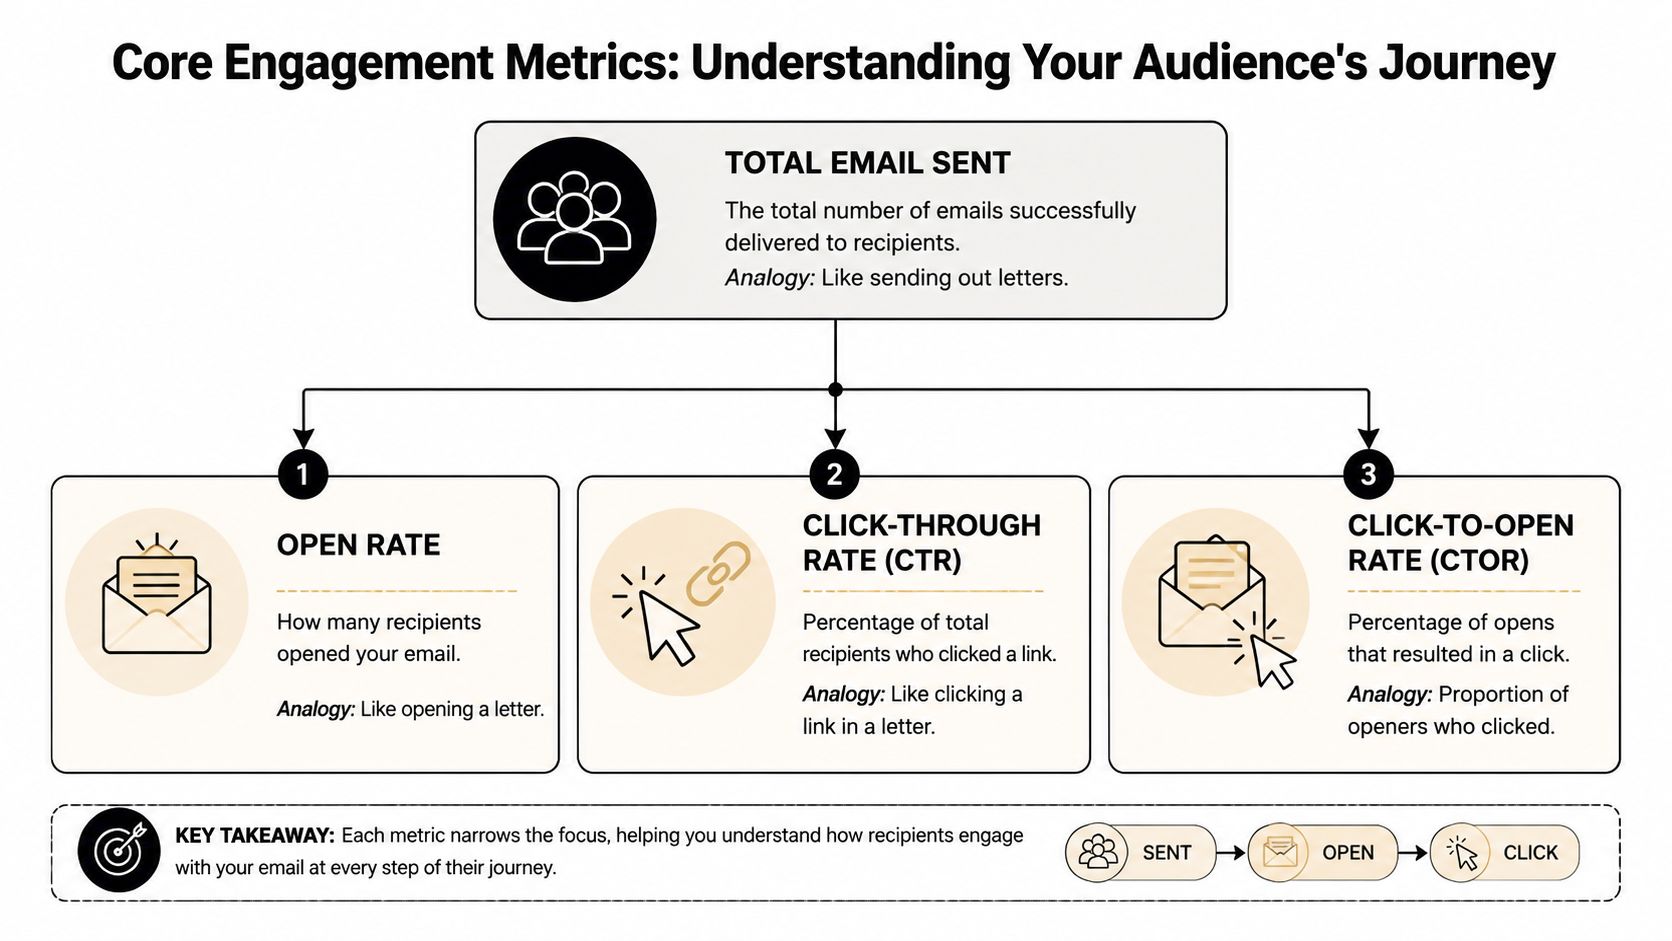
Open rate tells you if anyone picked up the letter
Open rate measures how many delivered emails were opened.
Formula:
- Open rate = unique opens / delivered emails × 100
Open rate works like the envelope test in direct mail. The message has arrived, but the recipient still has to decide whether it looks worth their time. Subject line, sender name, preheader, audience familiarity, and inbox placement all affect that choice.
Use open rate as a screening metric. It helps answer whether the inbox presentation did its job. It does not tell you whether the campaign produced qualified traffic, pipeline, or sales.
That distinction matters by business type. An e-commerce brand may accept a lower open rate on a broad promotion if the campaign still drives orders. A SaaS company sending onboarding emails usually needs stronger opens because those messages support activation. An agency newsletter may get respectable opens and still produce no meetings if the content never creates a reason to reply or click.
Two mistakes show up constantly:
- Using open rate as the win condition: opens measure attention, not business impact
- Comparing unlike emails: a flash sale, a webinar invite, and an invoice reminder serve different jobs and should not share one benchmark
If you want a practical outside read focused on subject lines, sender identity, and inbox-level factors, this guide on boosting email open rates for sales is worth reviewing.
One caution here. Open tracking is useful, but imperfect. Privacy features can inflate opens in some mail clients, so treat open rate as directional. If you see a jump in opens without any lift in clicks or replies, check your tracking setup before you rewrite every subject line.
CTR and CTOR show where interest breaks down
After the open, the next question is whether the email created enough clarity and motivation to earn a click.
Click-through rate (CTR) measures the percentage of delivered recipients who clicked a link.
- CTR = unique clicks / delivered emails × 100
Click-to-open rate (CTOR) measures the percentage of openers who clicked.
- CTOR = unique clicks / unique opens × 100
They sound similar, but they answer different questions.
| Metric | What it tells you | Best use |
|---|---|---|
| Open rate | Whether the inbox presentation worked | Diagnose subject line and sender trust |
| CTR | Whether the campaign drove action from the full delivered audience | Judge total campaign engagement |
| CTOR | Whether the email content persuaded people who opened | Diagnose message relevance and CTA strength |
CTR is the broader number. CTOR is the cleaner content diagnostic. If open rate is healthy and CTOR is weak, the subject line got the meeting, but the email failed the pitch.
That pattern usually points to one of four issues. The offer is vague. The CTA asks for too much commitment. The email is hard to scan on mobile. Or the message attracts the wrong segment with a broad promise that the body copy cannot support.
Here is how I apply these metrics by business model:
- E-commerce: CTR usually matters more than open rate once deliverability is stable. Product selection, offer strength, and CTA placement drive sales. A copyable dashboard view: campaign name, segment, open rate, CTR, revenue per email, top clicked product.
- SaaS: CTOR often deserves extra attention. If users open lifecycle or product education emails but do not click, the message is not connecting product value to the next step. A useful dashboard view: email type, open rate, CTOR, activation event rate, demo starts, trial conversions.
- Agencies and service firms: Clicks matter, but so do replies and booked calls. CTR can look average while the campaign still creates qualified conversations. A practical dashboard view: campaign, open rate, CTR, reply rate, call bookings, proposal requests.
A few patterns are reliable enough to use as a first-pass diagnosis:
- Low opens, low CTR: start with targeting, sender identity, subject line, and inbox placement. Review common email deliverability issues before you rewrite the whole campaign.
- Good opens, low CTOR: fix the email itself. Tighten the offer, make the CTA specific, and reduce visual clutter.
- Modest opens, strong CTOR: the message works for the people who see it. Segment tighter or resend with a new subject line.
- Strong clicks, weak conversions later: keep the email mostly intact and inspect the landing page, form, or offer handoff
For SMBs, these three metrics are enough to spot most campaign problems fast. Ask the questions in order. Did recipients notice the email? Did the message create interest? Did that interest turn into a meaningful action?
Audience Health and Deliverability Check
A campaign can look decent on the surface while the list underneath decays. That's why audience health deserves its own review. You're not just measuring campaign response. You're checking whether your email asset is still usable.

Deliverability is list quality made visible
Start with bounce rate. This tells you how many emails weren't delivered. In practice, I split bounces into two buckets:
- Hard bounces: permanent failures, usually invalid or dead addresses
- Soft bounces: temporary failures, often caused by mailbox issues or server-side problems
Hard bounces are the bigger warning sign for list quality. If they keep appearing, something is wrong upstream. Maybe form quality is poor. Maybe an old list was imported. Maybe sales reps are adding weak contact data into the CRM.
Deliverability is where many teams misread the problem. They assume poor opens mean bad subject lines, when the problem is that the emails never had a fair shot at the inbox. If your sender reputation slips, your best copy won't save you.
That's also where a focused deliverability review helps. Mailneo's guide to common email deliverability issues is a good starting point if your campaigns look inconsistent across sends.
Clean lists outperform large messy lists. A smaller audience that actually receives and wants your emails is worth more than a bloated database.
Churn signals whether your cadence fits your audience
The second half of list health is audience churn. The metrics I care about most are unsubscribe trend, spam complaints, inactive subscriber buildup, and list growth quality.
A low unsubscribe rate isn't automatically good. Sometimes it just means you barely email people, so they forget you exist instead of opting out. Then when you finally send a campaign, engagement is weak because the relationship is cold.
Use unsubscribes as feedback, not as an insult. If a segment leaves after every product update, the content might be mismatched. If unsubscribes spike after promotional pushes, the issue might be cadence or expectation-setting.
A practical health check looks like this:
- Review bounce patterns: Separate hard from soft. Remove permanently bad addresses fast.
- Watch unsubscribe trends by campaign type: Some content earns exits. That doesn't always mean it's bad, but it needs context.
- Look at inactivity windows: Subscribers who haven't engaged for a long time can drag down performance and distort reporting.
- Check acquisition sources: Giveaway leads, checkout signups, lead magnets, and demo requests behave differently.
For SMB owners, list growth is only healthy when it brings in people who fit the business. A list that grows with poor-fit contacts creates fake confidence. The total audience gets bigger while the responsive audience gets smaller.
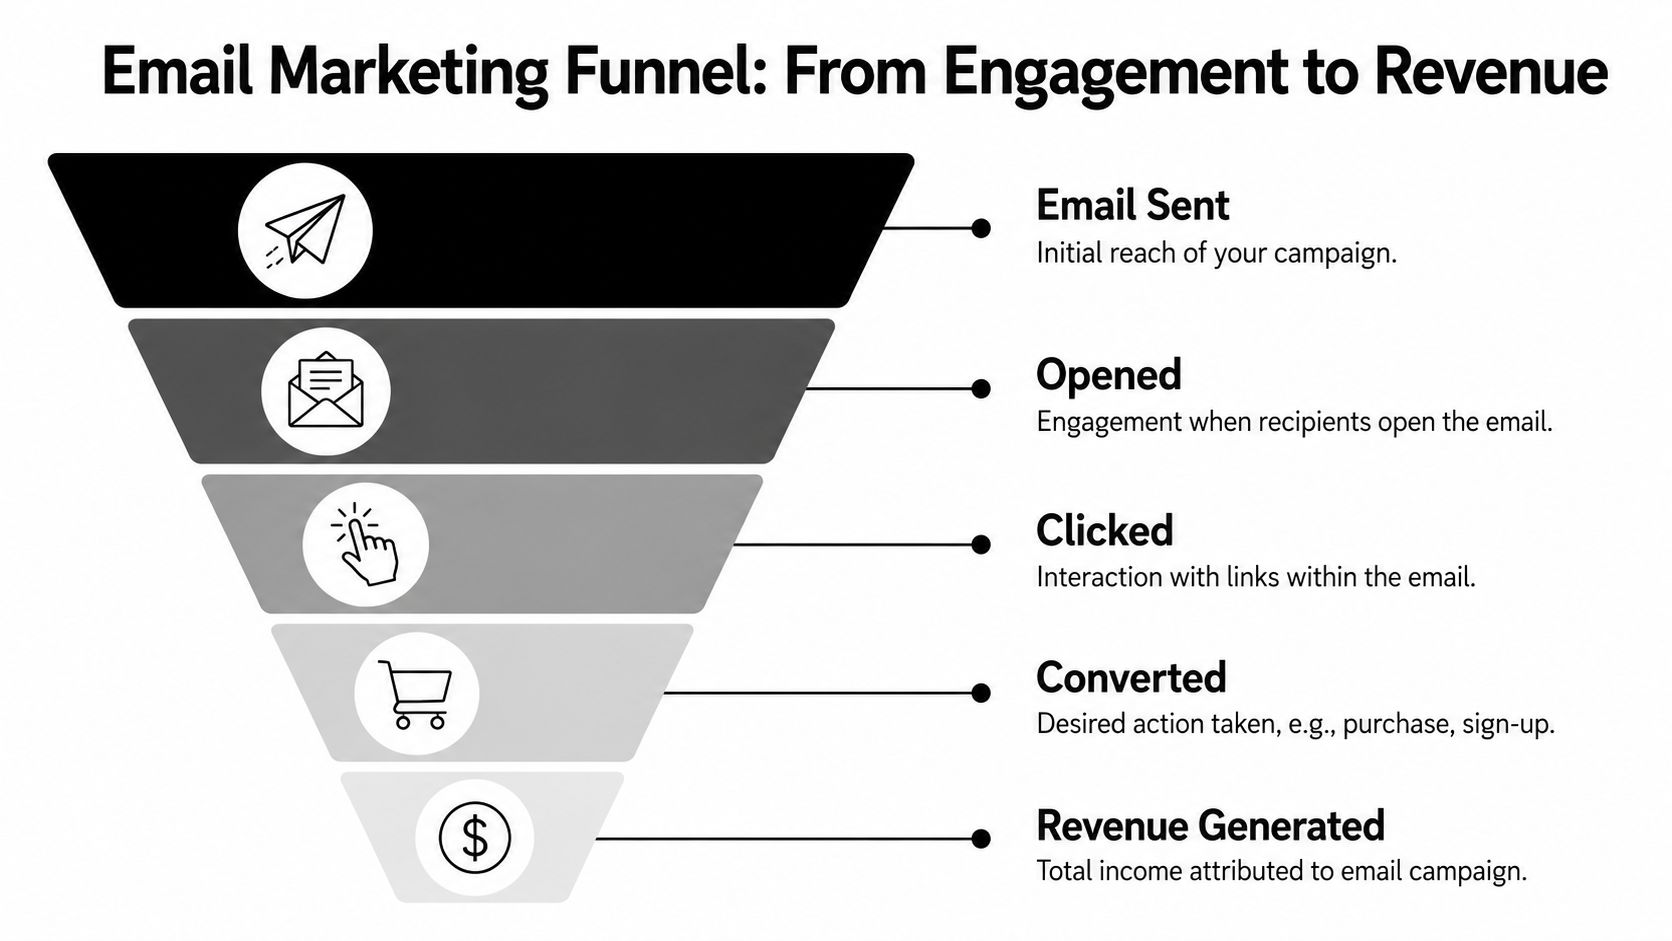
The Bottom Line Outcome and Revenue Metrics
Engagement tells you whether the email got attention. Outcome metrics tell you whether attention turned into something a business can use. That could be a sale, a demo booking, a trial start, a consultation request, or a renewal.
Track conversion before you obsess over revenue
Conversion rate answers the most important campaign question: did recipients take the action you wanted?
Formula:
- Conversion rate = conversions / delivered emails × 100
For an e-commerce store, that conversion may be a purchase. For SaaS, it may be a trial activation or booked demo. For an agency, it may be a lead form submission or strategy call request.
If you don't have advanced attribution set up, use the basics well:
- Add UTM parameters: This lets Google Analytics separate traffic by campaign, message, and source.
- Use distinct landing pages when possible: That reduces attribution ambiguity.
- Match one email to one primary action: Too many competing goals muddies conversion analysis.
A useful mental model is this: opens are attention, clicks are curiosity, conversions are commitment. Businesses don't bank curiosity.
Later in the buying path, you can support deeper attribution with CRM stages, e-commerce tracking, or product analytics. But even a simple setup is enough to tell whether an email is driving meaningful behavior.
A short visual can help teams align on that progression:
RPE and ROI turn email into a business case
Two metrics help email earn respect in budget discussions.
Revenue per email (RPE) asks how much value each sent email generates on average.
- RPE = total attributed revenue / total delivered emails
This is especially useful for comparing campaigns with different list sizes. A large blast may bring in more total revenue, but a segmented send can still be the better operator if each delivered email produces more value.
ROI goes one level higher.
- ROI = (revenue attributed to email - cost of email program) / cost of email program
Your costs can include platform fees, copywriting time, design, list cleaning tools, and agency support. You don't need perfect accounting to make this useful. You need consistent accounting.
If you want a simple way to model that without building a spreadsheet from scratch, Mailneo's email ROI calculator is a practical shortcut.
Revenue metrics stop email from being judged by applause. They force it to be judged by contribution.
One caution. Don't let last-click logic erase email's broader role. Some campaigns won't close the sale directly, but they still warm up prospects, reduce hesitation, or bring people back into a purchase path. That's why I track both direct conversions and the supporting metrics around them.
Interpreting Metrics for Your Business Model
The same dashboard can mislead three different businesses in three different ways. A store, a SaaS company, and an agency don't need identical email scorecards. They need metrics tied to how they make money.
E-commerce brands need commercial clarity
E-commerce teams usually get the most value from metrics closest to the transaction. They care about revenue, orders, product interest, and how campaigns influence buying behavior.
A promotional campaign with average engagement but strong purchase intent may beat a beautifully designed newsletter that gets clicks and no carts. For stores, a lot of reporting should revolve around commercial questions:
- Which campaigns move inventory?
- Which segments buy without heavy discounting?
- Which automations recover intent, such as cart or browse behavior?
- Which product categories earn clicks but stall on the site?
The trap for e-commerce is overvaluing opens. Curiosity doesn't pay shipping bills.
SaaS teams need behavioral signals
SaaS teams often sit in a different reality. The sale may take longer, involve multiple touches, or depend on product adoption after signup. That means email metrics should connect to activation and retention signals, not just immediate click behavior.
For SaaS, I usually care more about:
- onboarding email engagement
- feature education clicks
- trial-to-demo progression
- reactivation behavior
- churn-risk segment engagement
An onboarding email that nudges a user toward first value can be worth more than a flashy announcement campaign with broader engagement. In SaaS, email often supports product usage, not just top-of-funnel traffic.
Agencies need proof clients can understand
Agencies live in a reporting environment. The right metric isn't only the one that matters internally. It's the one a client can connect to business value quickly.
That usually means translating technical email signals into plain outcomes:
- lead volume influenced by campaign
- booked calls from a nurture flow
- revenue tied to promotional sends
- improvement in list quality over time
- segment-level performance that informs future targeting
Clients don't pay agencies to admire dashboards. They pay for clarity and movement.
Here's a simple comparison template you can copy.
Key Metrics by Business Model
| Metric | E-commerce Priority | SaaS Priority | Agency Priority |
|---|---|---|---|
| Open rate | Useful as an inbox health signal | Useful for message traction in lifecycle emails | Useful for client reporting, but not enough alone |
| CTR | Helpful for product and offer interest | Helpful for education and feature discovery | Helpful for showing audience response |
| CTOR | Good for judging creative and merchandising relevance | Strong indicator of message-to-user fit | Useful for diagnosing campaign quality |
| Conversion rate | Core metric for purchases and offer effectiveness | Core metric for demo, trial, or activation goals | Core metric for proving campaign value |
| Revenue per email | High priority for campaign comparison | Lower priority unless sales cycle is short | High priority for revenue-focused accounts |
| Bounce rate | Important for sender health | Important for lifecycle reliability | Important because clients notice inbox problems fast |
| Unsubscribe trend | Important for cadence and promo pressure | Important for content fit and lifecycle fatigue | Important for retention of client-owned audiences |
| List growth quality | Important if acquisition feeds repeat sales | Important if lead quality affects pipeline | Important because list size alone can mislead clients |
The point isn't to ignore the rest. It's to avoid treating every metric as equally strategic.
Building Your Email Marketing Dashboard
A good dashboard does two jobs. It summarizes performance fast, and it makes the next action obvious. Most dashboards fail because they try to be exhaustive. They become a spreadsheet museum.
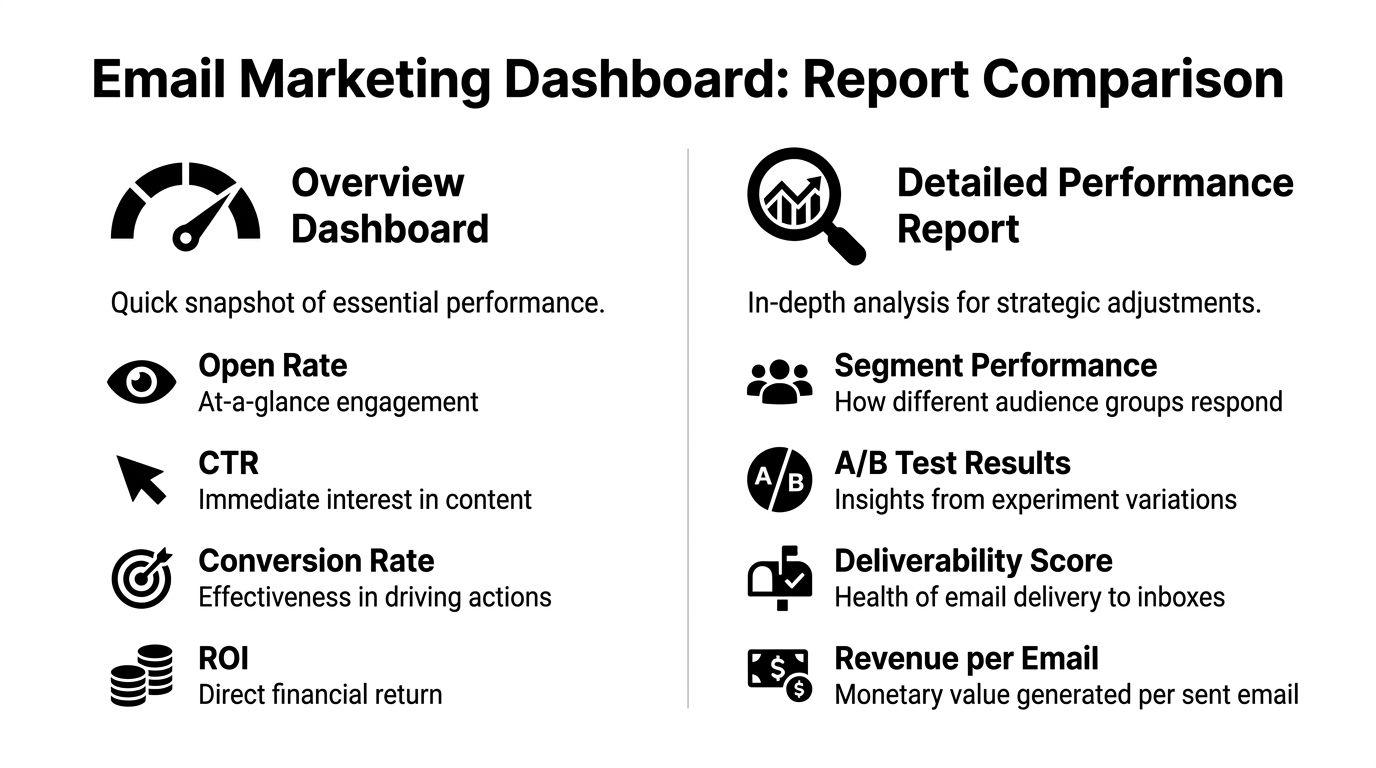
Strategic dashboard for leadership
Leadership doesn't need every campaign detail. They need a clear view of contribution, trend, and risk.
I'd include these fields:
| Metric group | What to show | Why it belongs |
|---|---|---|
| Business outcome | Conversions, attributed revenue, pipeline influence, or qualified leads | Connects email to business goals |
| Efficiency | Revenue per email, program cost, ROI direction | Helps justify budget and staffing |
| Audience health | Deliverability status, unsubscribe trend, list growth quality | Flags structural problems early |
| Trend view | Period-over-period movement by major campaign type | Shows whether performance is improving or stalling |
Keep commentary short. One line per metric group is enough if it answers: what happened, why it matters, what needs attention.
A leadership dashboard should help an owner or exec decide whether to invest more, fix a bottleneck, or change priorities. It should not require them to decode marketing jargon.
Tactical dashboard for the marketing team
The tactical version is different. This one should help the team make campaign decisions in the next send, not just report what already happened.
Include a more operational set:
- Campaign-level engagement: open rate, CTR, CTOR, top-clicked links
- Segment performance: new subscribers, repeat buyers, trial users, inactive contacts
- Creative and testing notes: subject line tests, CTA tests, layout differences, resend outcomes
- Deliverability details: bounce categories, complaint patterns, inbox anomalies
- Landing page response: conversion path by campaign and segment
The best tactical dashboard reads like a diagnosis sheet. It should show what changed, for whom, and what to test next.
A simple reporting rhythm helps:
- After each campaign: review engagement, clicks, and primary conversion path.
- Weekly: compare segments and campaign types.
- Monthly: assess list health, revenue contribution, and repeated winners or losers.
One more practical point. Don't put every metric in one view. Build separate tabs or panels for leadership and operators. The owner wants signal density. The email manager needs working detail.
How to Troubleshoot and Optimize Low Metrics
When a metric drops, don't start redesigning everything. Work backward from the symptom. Email performance is usually a chain problem. One weak link makes the whole campaign look bad.
If opens are weak start at the inbox
Low opens usually come from one of four places:
- Inbox presentation: Subject line is vague, overhyped, or disconnected from the audience's current need.
- Sender trust: The from-name looks generic, unfamiliar, or too corporate for the relationship.
- Segmentation: You sent one message to too broad a list, so relevance collapsed.
- Deliverability: Messages may be landing outside the primary inbox.
Check those in that order. Teams often waste time rewriting body copy for emails people never opened.
If clicks or conversions lag inspect the path
If opens are fine but clicks are poor, the issue sits inside the message. Review the path from first line to CTA.
- Message match: Does the email deliver on what the subject line promised?
- CTA clarity: Is there one obvious next step, or several competing ones?
- Mobile readability: Buttons, spacing, and hierarchy need to work on a phone first.
- Offer strength: Useful copy can't rescue a weak or unclear offer.
If you want a deeper outside reference focused on click behavior, this practical guide for marketers on email CTR is a solid diagnostic read.
When conversions are the weak spot, shift attention to the destination:
- Landing page continuity: The page headline and offer should feel like the email's natural next step.
- Form friction: Too many fields or unclear asks reduce follow-through.
- Audience intent: Some segments are ready for purchase. Others still need proof, education, or reassurance.
- Tracking gaps: Sometimes the campaign worked, but your measurement setup didn't capture it correctly.
The best optimization habit is simple. Change one meaningful variable at a time, log what changed, and review patterns over multiple sends. Random tweaking creates random learning.
Mailneo helps businesses run smarter email programs without making the process complicated. If you want a simpler way to plan campaigns, track performance, and turn email data into action, explore Mailneo.
Explore: Email Marketing Strategy
Related Articles
Email marketing statistics 2026: 50+ key benchmarks
Email marketing statistics for 2026 show a channel that still outperforms paid social on ROI, still opens mostly on mobile, and still lives or dies by deliverability. Here are 50+ benchmarks across opens, clicks, revenue, automation, AI adoption, and inbox placement, each with a named source.
Email Marketing ROI: Statistics, Benchmarks & How to Improve
Email marketing ROI is the revenue a program returns for every dollar spent on it. Industry studies peg the average at $36 to $42 per $1 (Litmus, DMA). This pillar breaks down current benchmarks, the full calculation, channel comparisons, and specific levers that move the number up.
How to Improve Click Through Rates in 2026
To improve click-through rates in 2026, start with your email CTR baseline, compare it against industry benchmarks, simplify each campaign around one clear action, segment by behavior, and use structured A/B testing to keep improving.
Fix Email Deliverability Issues: Your 2026 Guide
Email deliverability issues are usually a stack of authentication, sender reputation, engagement, list quality, and sending-pattern problems. This guide gives teams a diagnostic workflow for finding the real cause before changing copy or platforms.
Ready to supercharge your email marketing?
Start sending smarter emails with AI-powered campaigns. No credit card required.
Get Started Free